Vladimir Shkurko
Power BI Sales & Profit Dashboard
Power BI • DAX • Executive dashboard
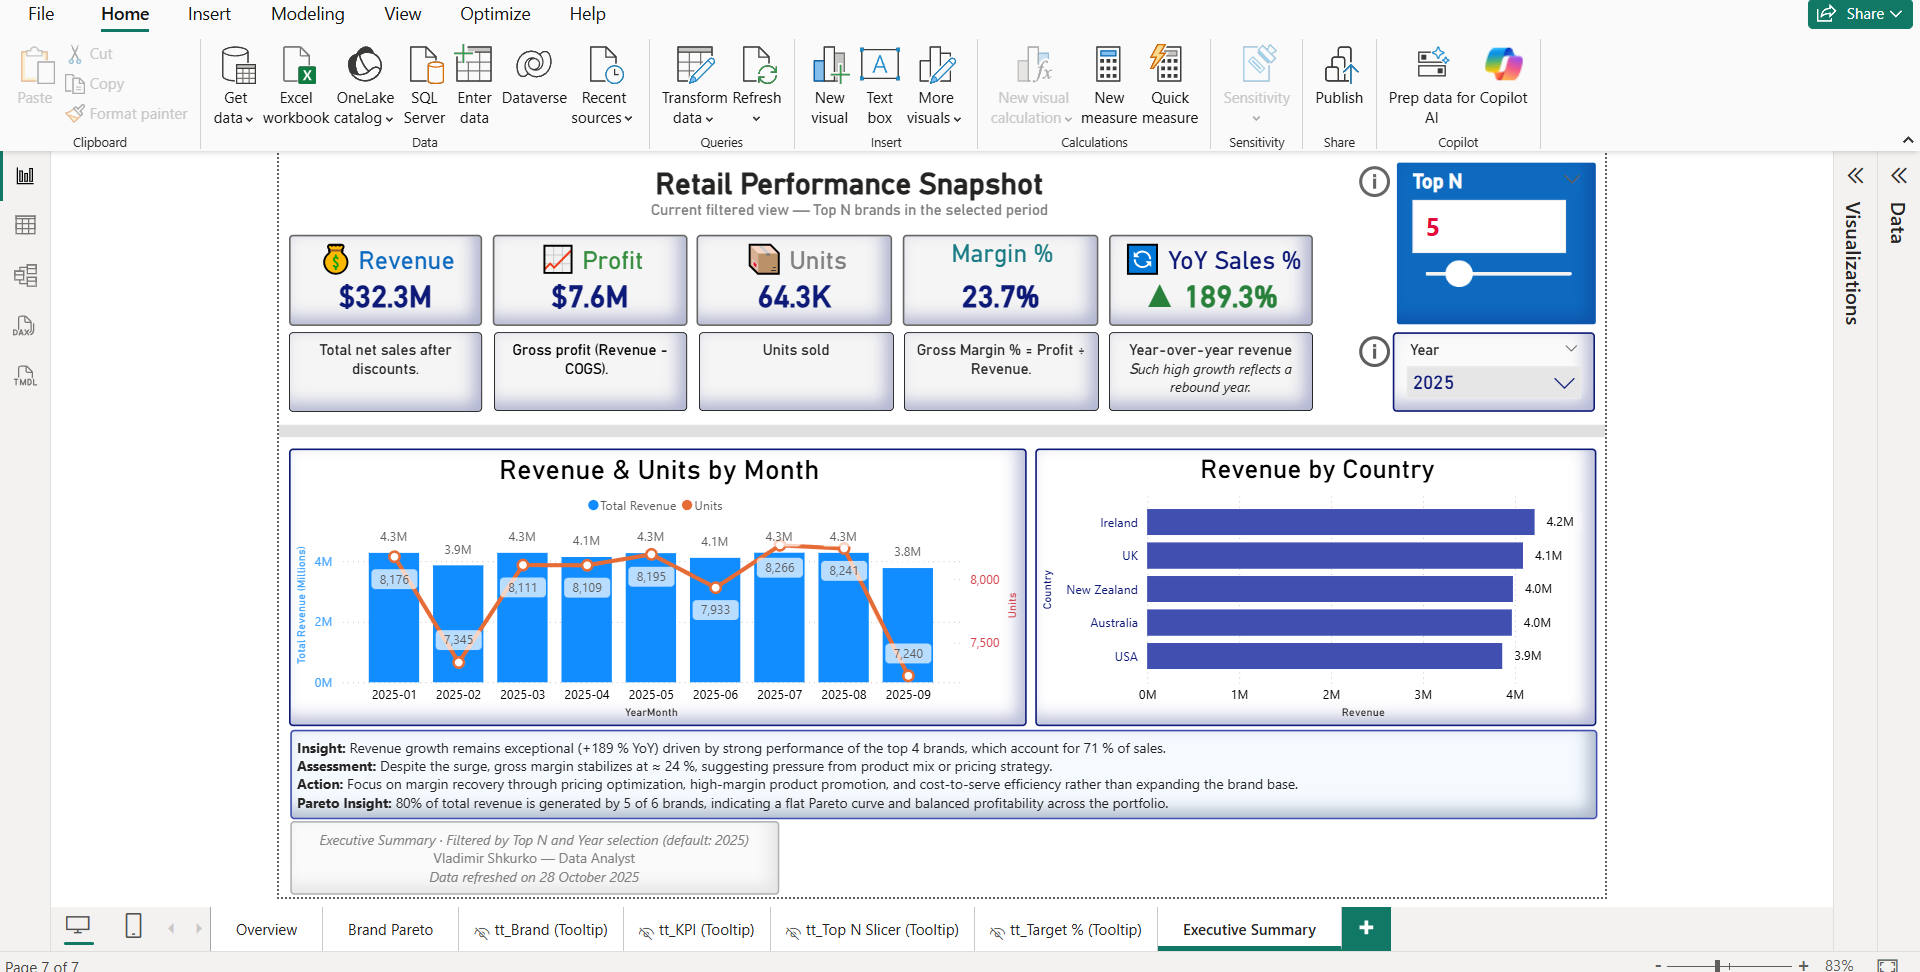
Summary: Executive dashboard with Sales, Profit, GM%, and YoY; drill-downs by Segment and Product; region split; and a Top-N what-if parameter. Built from the standard Financials sample.
Interactive report
Results
- One-look KPIs (Sales, GM%, YoY) for execs.
- Top products/segments surfaced with a Top-N slider.
- Ad-hoc drill-downs with standardized DAX measures.
- Clear month-over-month trends and region comparison.
How it was built
- Model: clean dimension tables; explicit date table with marked relationship.
- DAX: base measures (Sales, Cost, Profit, GM%), YoY/YoY% via
CALCULATE+DATEADD. - What-if: parameter table for Top-N + measure-driven ranking.
- UX: slicer column, buttons for “Show/Reset slicers”, consistent tooltips.